What BTTS Actually Demands From You
Both teams to score sounds simple. Two teams, two goals, one bet. The problem is that most people treat it like a coin flip dressed in football kit, picking attack-heavy fixtures on instinct and wondering why the clean sheets keep piling up.
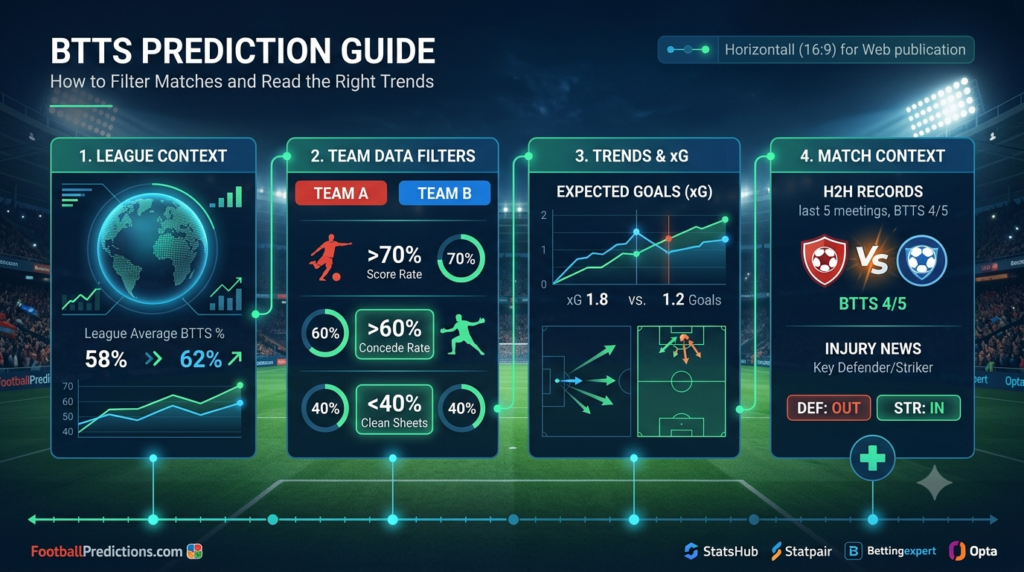
Good btts prediction requires something more structured. According to FootballPredictions.com, successful BTTS betting combines odds comparison, team performance analysis, match context, and advanced statistical tools including expected goals and BTTS trends. That four-part requirement matters because skipping any one piece tends to unravel the others. The process needs to be repeatable, not reactive, and it applies equally across traditional sportsbooks and crypto platforms; the USDT and Crypto betting guide covers deposit and withdrawal mechanics for coins like Bitcoin, Ethereum, and USDT if that side of the equation needs sorting.
Start With the League, Not the Match
StatsHub makes a point that gets skipped constantly: check the overall BTTS percentage for the league you are targeting before anything else. Some leagues are structurally low-scoring. Others produce chaotic, open football almost every weekend. Applying the same selection criteria across both environments is a mistake that no amount of team-level research can fix.
Once you have that league context locked in, you zoom to the team level. The core question is straightforward: how often does each team score, and how often does each team concede? Recent form examines these frequencies across the last several matches, and that frequency is the foundation everything else sits on.
Filtering Criteria That Separate Good Selections From Bad
Strong attacking teams with weaker defences are the primary target. Teams with weak defences are more likely to concede, which increases the probability of both teams finding the net. Sound logic, but it needs a threshold to become usable.
Statpair puts a number on it: both teams should be conceding in 60% or more of their games, with a clean-sheet rate below 40%. If one team keeps clean sheets in more than four out of every ten matches, the BTTS case weakens considerably regardless of how good the opposition attack looks on paper. These thresholds sit alongside broader mathematical approaches to football predictions that help identify where the numbers support a bet and where they don’t.
Fixture profile matters too. Evenly matched teams with strong offensive records and vulnerable defences represent the strongest BTTS candidates. Bettingexpert adds something worth noting: a team that scores regularly but also concedes regularly sits in a productive middle zone for this market. The scoring ability alone isn’t enough. You need the defensive leakiness on both sides.
There is the away favourite angle as well. Home teams facing stronger opposition tend to open up rather than park defensively, which creates space on both ends. Games where the superior side is on the road tend to produce goals from both teams more often than you’d expect.
Reading Form Without Being Fooled by the Scoreline
A raw goal count from the last five matches tells you less than you think. Did a team score three in a comfortable 3-0 where they dominated, or three in a chaotic 4-3 defeat? Those are completely different pictures of defensive vulnerability and attacking sustainability.
This is where expected goals becomes useful rather than decorative. Bookmakers already lean on xG models to price their markets; Stats Perform’s Opta platform analyses up to 20 context factors per shot to produce the numbers that feed those lines. If you want a deeper look at how xG statistics apply to football predictions, the concept rewards the time spent learning it. A team may not be scoring many goals, but if their expected goals numbers run high, it indicates they are creating quality chances and may be due to find their scoring touch. The reverse bites harder: a team that has scored several times but generated low xG is probably running on luck that will not hold.
For football predictions to be worth following, the underlying chance creation needs to support the surface results. A btts prediction built on xG alignment survives variance better than one built on raw scorelines alone.
Head-to-Head Records and When They Count
Statpair recommends checking the last five to eight head-to-head meetings between the two sides and treating BTTS appearing in 60% or more of those fixtures as a bonus indicator. The word bonus is doing real work in that sentence. H2H data reinforces a case. It rarely builds one from scratch.
Some rivalries have structural reasons for producing goals on both sides: tactical styles that clash in ways that prise open defences, or psychological dynamics in derby games. Bettingexpert notes that derby matches and fixtures with playoff implications can push teams forward even when caution might be wiser tactically. Emotional stakes override game plans. That pattern repeats across leagues and across seasons.
Injuries Are Not a Footnote
Injuries to key defenders or strikers can shift the likelihood of goals being scored. Most bettors check for striker absences. Fewer check for centre-back injuries with the same seriousness, and almost nobody checks goalkeeper fitness until the team sheet drops.
A team missing their first-choice goalkeeper or a dominant centre-back has a structurally weaker defence than their season stats suggest. Checking starting line-ups before placing any bet is the last gate in the process. Skip it and you’re betting on a team that no longer exists in the form you analysed.
A Decision Rule Worth Keeping
Statpair’s decision framework is the most practical summary available: if all key indicators align, place the bet; if one or two are missing, skip or reduce the stake. That is not a formula for certainty, but it keeps you from forcing selections when the data isn’t there. The same discipline applies when hunting for football value bets in other markets: if the evidence isn’t stacked in your favour, walk away.
Prediction today markets move quickly. A thorough pre-match checklist, league context first, then concede rates, xG, H2H, and injury news, takes maybe fifteen minutes per fixture. That time separates a considered bet from a guess with odds attached.
